Chapter 1
Overview Of Sector Development
Despite the subdued economic outlook in the short term and an array of challenges, there is an overall positive sentiment among executive managers within European industrial goods firms. Survey results indicate that more than 50% of these executives hold a favorable view concerning the state of the industrial goods sector. In contrast, a minority — less than 10% — express a negative sentiment. This data suggests that despite the various challenges present in today’s business environment, optimism trumps pessimism. Notably, companies boasting higher revenues — specifically those that exceeded €5 billion in 2022 — demonstrated an even more positive outlook. A remarkable 71% of respondents from these larger entities rated their sentiment above seven out of 10. This trend indicates that representatives from larger corporations are likely more confident navigating the present economic landscape.
Exhibit 1: What is your general sentiment regarding the state of the industrial goods sector?
Share of responses in %
Value shift
The capital market performance of the sector in Europe beats the MSCI Europe index by more than 5% Compound Annual Growth Rate (CAGR), underlining the overall strong performance of the sector compared to other European sectors, as illustrated in the below graph.
Exhibit 2: Stock index performance, 2013-2022
Indexed (2013=100), price at year end
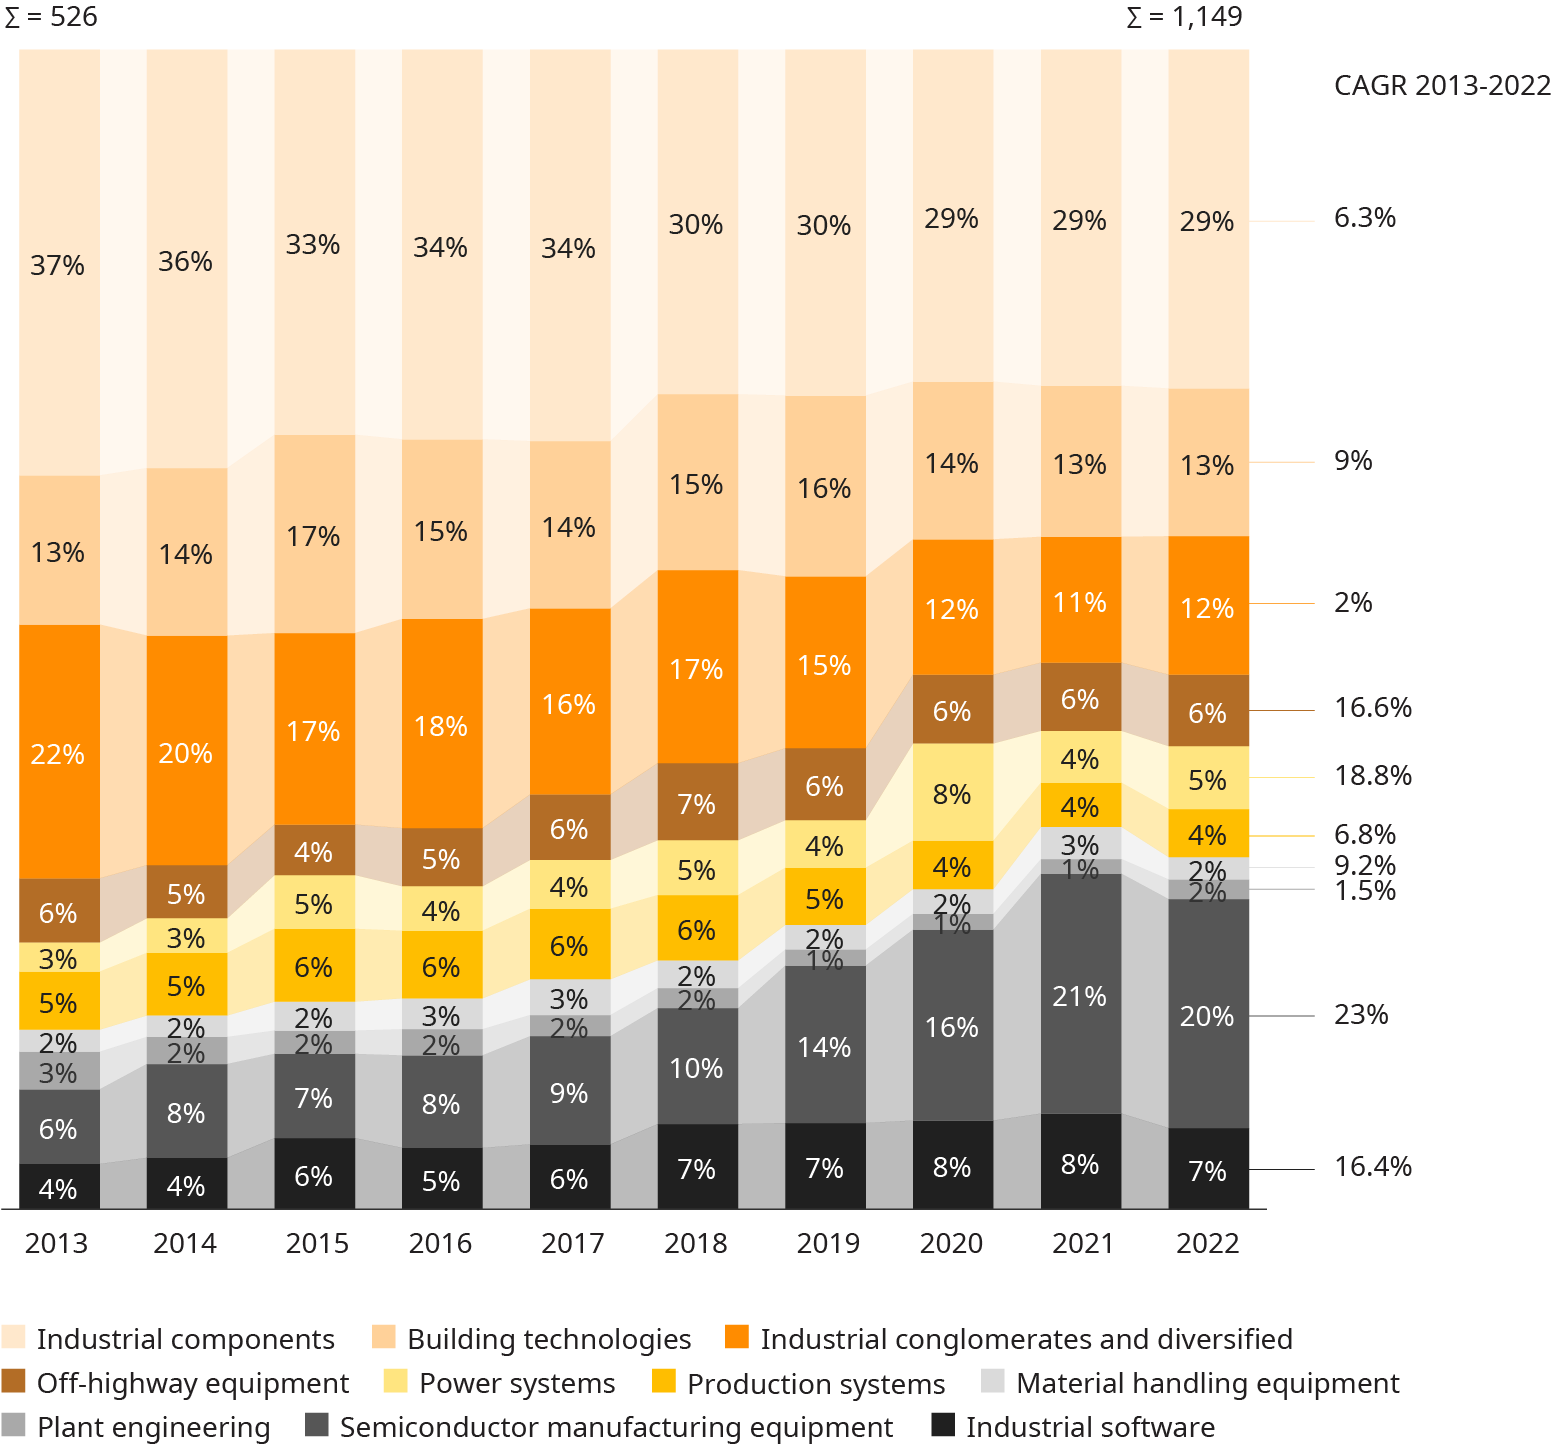
At the same time, there has been a noticeable shift in value between various sub-sectors. Particularly, firms that specialize in industrial software and semiconductor equipment have seen a surge in value relative to the overall industrial sector market capitalization. Over the last decade, their relative value share has expanded significantly, from 10% to 27%.
This growth has been at the expense of other, more traditional sub-sectors.
The “winning” sectors have reaped the benefits of major trends such as digitalization and the continuous advancements in factory and process automation. On the other hand, power systems players — who experienced steady growth from 2013, mainly because of the boost the renewable energy portion received from the decarbonization megatrend — faced a setback in 2021. This decline was primarily due to the rising costs of raw materials, as well as supply chain and market challenges faced by the wind power industry in Europe.
Industrial conglomerates have seen a reduction in their relative value share, with only limited value creation over the past 10 years. Interestingly, during this period, several large conglomerates that underwent partial break-ups managed to significantly increase their market value for the remaining, now smaller, less complex portion of the business.
This trend emphasizes that investors tend to prioritize focus over diversification of a company’s operations.
Meanwhile, traditional sectors like production systems, although losing in relative terms, have managed to gain value in absolute terms.
Exhibit 3: Value migration by sub-sector, 2013-2022
Market capitalization in % of total, billion €, European company sample
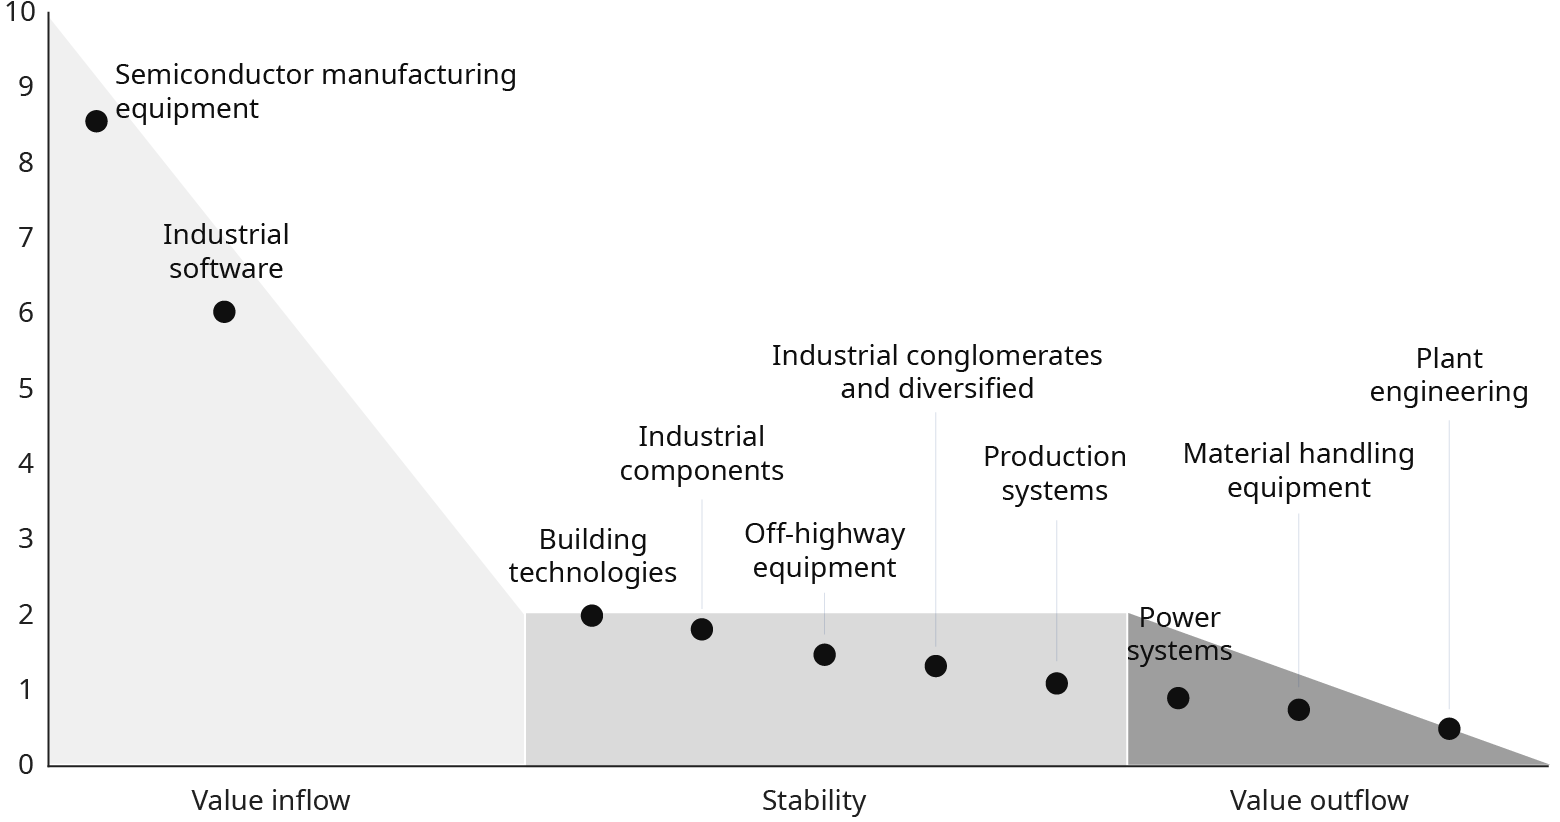
Consequently, value inflow in terms of market cap over sales, as shown on the graph below, varies. This KPI reflects future investor expectations for the respective firm in a sector relative to the current business size. Among all sectors, semiconductor equipment and industrial software, followed by building technology, emerge as the front-runners.
Conversely, sectors like material handling equipment and plant engineering lag behind, indicating limited positive investor expectations.
Exhibit 4: Value inflow and outflow by sub-sector, 2022
Market capitalization/revenue, European company sample, qualifying date December 31
It’s also worth looking at additional cuts: From a regional perspective — defined by location of headquarters — North American firms take an increasing share of the total global market value of the industrial goods sector. Especially from 2021 to 2022, we see a strong value shift, with the share of North American industrials jumping from 33% to 37% of the total global value, and with the share of European industrials shrinking from 28% to 26% at the same time.
Exhibit 5: Value migration by region, 2021-2022
Market capitalization in % of total, European company sample, qualifying date December 31
“
Particularly, firms that specialize in industrial software and semiconductor equipment have seen a surge in value relative to the overall industrial sector market capitalization
Value drivers
The sector value and its migration are driven by several key underlying performance drivers, which we will explore in more detail in the following paragraphs.
Besides the well-established drivers top-line growth, profitability, and capital intensity, we introduce another dimension to the framework: sustainability performance. Sustainability is quickly becoming a determining factor due to the heightened attention it receives from investors, banks, regulators, and sector end markets.
Exhibit 6: Key value drivers
A sector of profitable growth
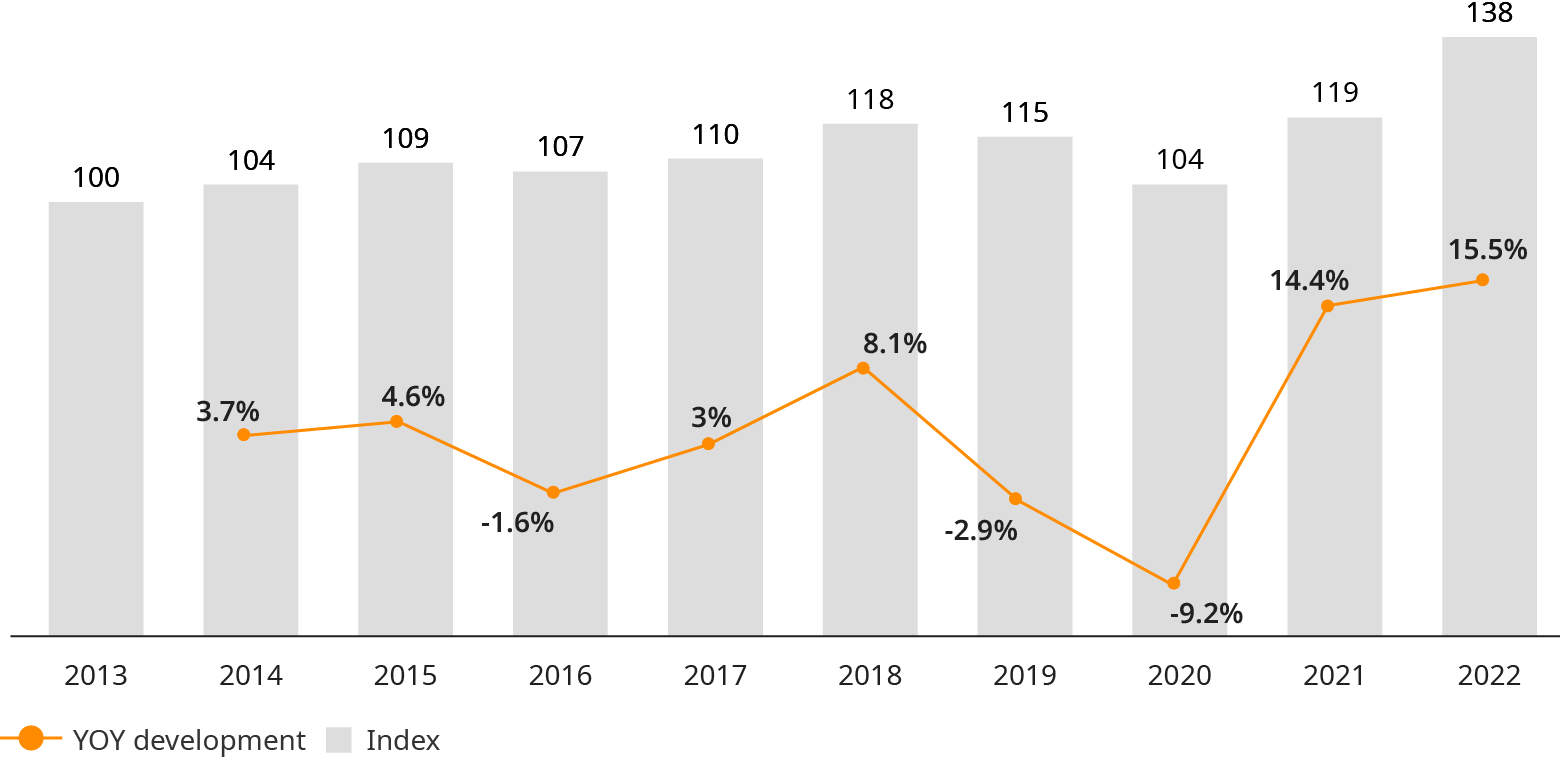
The European industrial goods sector has demonstrated a commendable resilience since the Covid crisis. Sector revenues rebounded impressively, now surpassing pre-pandemic levels by being 17% higher than those of 2018. Moreover, nominal revenue in 2022 increased by 20% over the previous year.
Sector profitability in 2022 experienced an uptick, registering nearly one percentage point higher than pre-pandemic levels in 2018. This quick rebound not only underscores the resilience of the companies but also draws attention to their adaptability in the face of massive supply chain bottlenecks.
Over a longer time frame, spanning a 10-year horizon, the sector has managed to maintain a solid Compound Annual Growth Rate (CAGR) of more than 3.6%. When evaluating profit as a central value driver, the sector exhibits noteworthy performance. There’s a consistently robust “earning power” with the average 10-year EBIT profitability being 9.4%. In 2022, this figure was even close to a double-digit margin of 10%.
In summary, the industrial sector has shown to be a relatively safe harbor in turbulent times.
Exhibit 7: Industrial goods sector revenue, 2013-2022
Indexed (2013=100), YOY in %, European company sample
Exhibit 8: Performance by sub-sector, 2013-2022
Weighted average EBIT margin and revenue Compound Annual Growth Rate (CAGR) in %, European company sample
However, differences in performance are significant across various sectors. Semiconductor equipment and industrial software stand out as front-runners, outpacing others in terms of profitable revenue growth. Conversely, certain sectors traditionally fall behind, notably plant engineering but also sectors like production systems (profit below overall average) or off-highway equipment (revenue growth below overall average).
The power systems sector is currently underperforming. This sector, predominantly led by wind turbine original equipment manufacturers (OEMs), faces substantial challenges in regaining profitability. These challenges stem from the continuing repercussions of price pressure, raw material price hikes, slow-paced development of new wind power sites, and recurrent technical problems experienced by some OEMs.
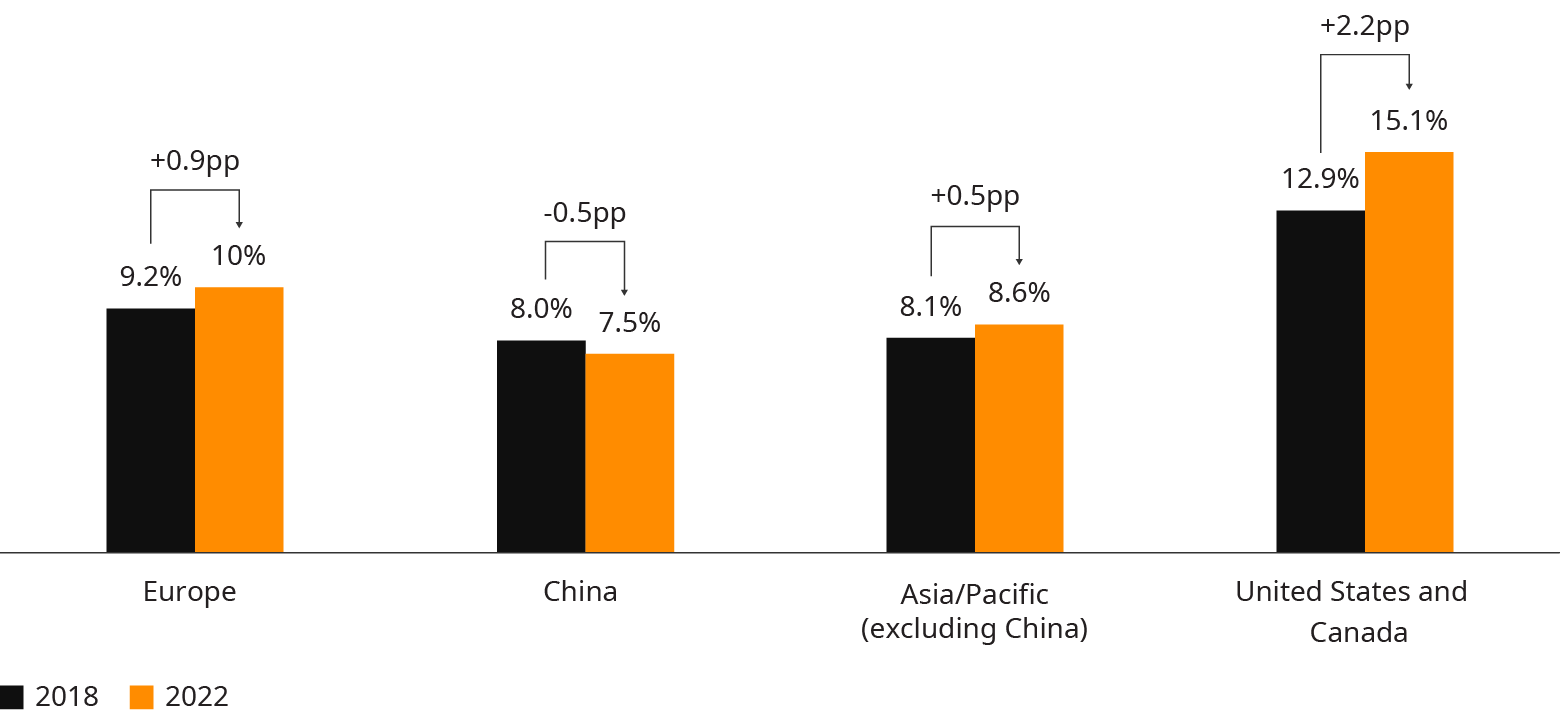
American companies perform better in both market value inflow and operational performance, not only because of a high share of structurally outperforming sectors like industrial software. There is also a higher performance in sectors where Europe traditionally plays strong, such as production systems or building technology. Key reasons include lower energy costs, less regulation, easier staff ramp-up/ramp-down, and a generally stronger commercial, profit-driven mindset prevalent among management and stakeholders.
In contrast, Chinese companies are witnessing a decline in profitability. By 2022, they were, on average, trailing European firms. Recent macroeconomic developments in China, like subdued growth and challenges in the real estate sector, suggest that a positive turnaround might not be likely, at least in the short term.
Exhibit 9: Profitability by region, 2018 versus 2022
Weighted average EBIT margin in %, global company sample
“
The European export model is not dead: European firms with an export focus are outperforming domestic and globalized businesses in terms of profitability
For another perspective on the data, we differentiated by global players (i.e., companies with a globally distributed asset base) versus export-oriented firms and mostly domestic players (i.e., companies with an asset base strongly concentrated in their home market). The results indicate that the European export model is not dead: European firms with an export focus take a sizeable share of the total number of firms (>20%) and are outperforming domestic and globalized businesses in terms of profitability (11.9% versus 7.2%/10.2%).
Rising capital requirements
The value of industrial goods firms has increased — despite an overall rise in capital intensity over the past decade, from 2013 to 2022.
Several, sometimes opposing, factors have likely influenced this trend in recent years. For one, capital intensity was driven upwards by rising inventories following major supply chain disruptions, especially during the last years. In some cases, the number of supply crises led to the reversal of the outsourcing trend of previous years, with many firms building up their internal capacities again — a process that’s inherently capital-intensive. Years with weak sales also had an impact on the curve in exhibit 10 — it technically increased the capital intensity quota, especially during the pandemic.
Conversely, there were factors with a dampening impact. The COVID pandemic and subsequent crises meant companies often made more conservative investments decisions, leading to less expansive capital allocation.
Exhibit 10: Capital intensity, 2013-2022
Capital employed/revenue, European company sample
Capital intensity varies between the sub-sectors. Industrial software firms, for instance, on average show a high intensity, mainly driven by goodwill on M&A and activated R&D. Sectors like plant engineering show a rather low intensity, driven by a typically high share of purchased value-add.
In a Return on Capital Employed (ROCE) comparison between the sub-sectors, there are high similarities with the EBIT performance by sub-sector — with a relatively strong performance of semi-conductor equipment producers, building technology firms, and industrial component players. In this comparison, a “softening effect” by the respective capital intensity can be observed. The production systems sub-sector with a rather low capital intensity, for instance, manages to achieve a relatively higher ROCE performance compared to an EBIT-based comparison.
Progress on sustainability performance — but still a lot to be done
In recent years, sustainability has become much more critical to industrial firms. This heightened emphasis is driven by several factors. Regulatory disclosure requirements, such as the Corporate Sustainability Reporting Directive (CSRD), have begun to exert pressure on firms. Customers are now more discerning, often demanding transparency about the carbon footprint of a product. Additionally, financial institutions are steadily incorporating ESG criteria into their lending decisions, with interest rates and credit approvals now often contingent on meeting these standards. Also, institutional investors and asset managers consider those criteria more and more when making investment decisions.
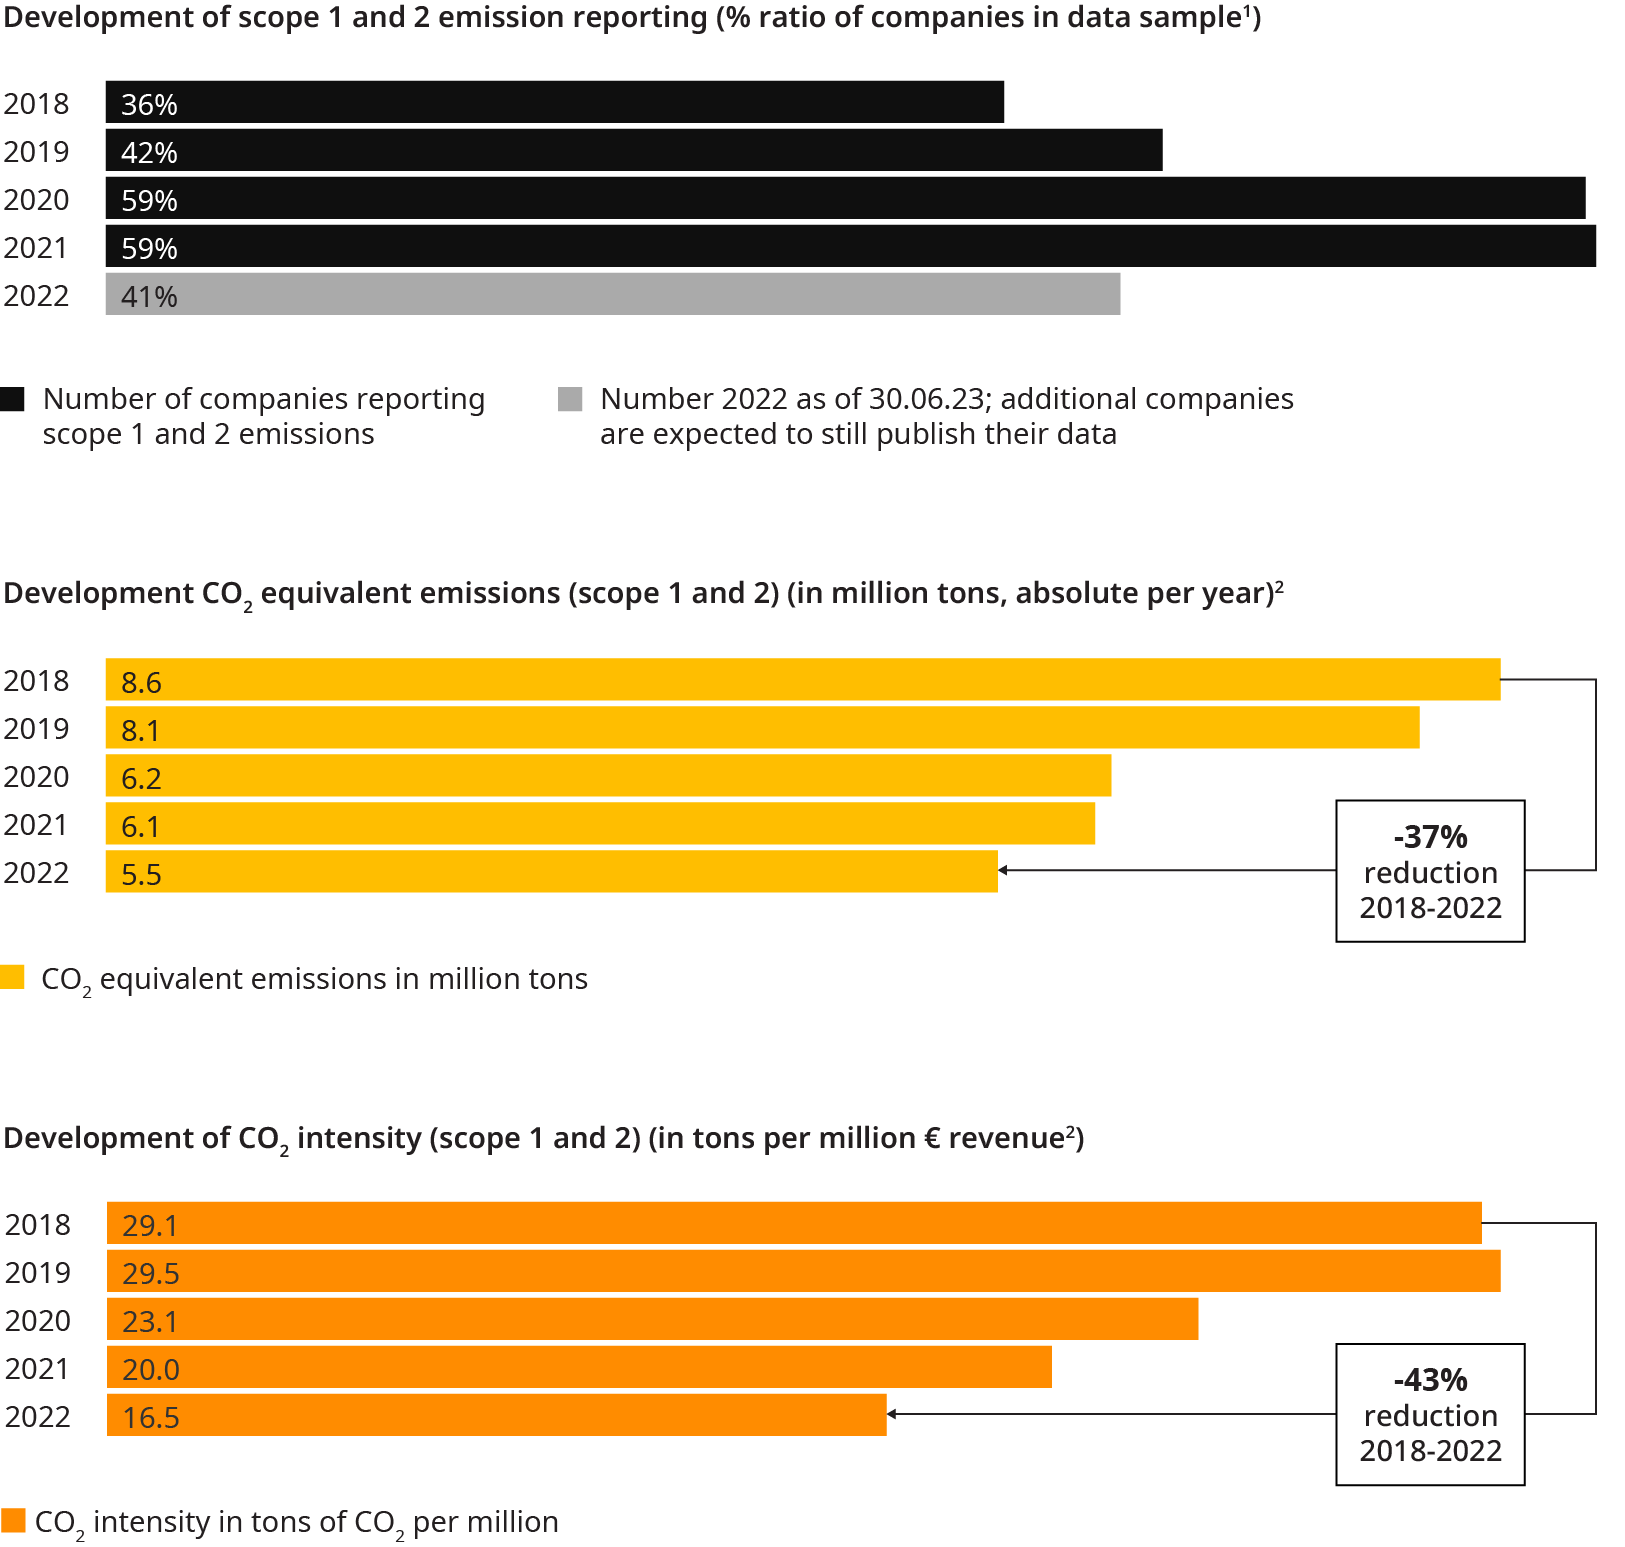
The majority of industrial companies have embarked on the sustainability journey, albeit at varying paces. Most have set scope 1 and 2 targets and have started to deliver against them.1 There is visible progress on this front: The European companies who have published scope 1 and 2 figures from 2018 to 2022 have managed to reduce their emissions by 37% in that time frame, which is clearly a move in the right direction.
However, even if taking 2021 as base year (it is the last year with full sample availability), only 59% of firms are reporting scope 1 and 2 emissions at all.
Exhibit 11: Scope 1 and 2 emissions performance
In addition, only a fraction of companies (less than 15%) is reporting scope 3 emissions.2 Of the more than 200 companies in the sample, only six have provided data on their scope 3 performance over the time frame of more than two years. For more than 97% of the leading European companies, scope 3 remains opaque. While the reluctance to disclose might be attributed to the challenges and intricacies involved in baselining and modeling carbon data throughout the value chain, it is still surprising that so few companies report scope 3. This type of transparency is not just a regulatory expectation; it is increasingly demanded by customers, making it business-critical.
Exhibit 12: Development of scope 3 emissions reporting
% ratio of companies in data sample1
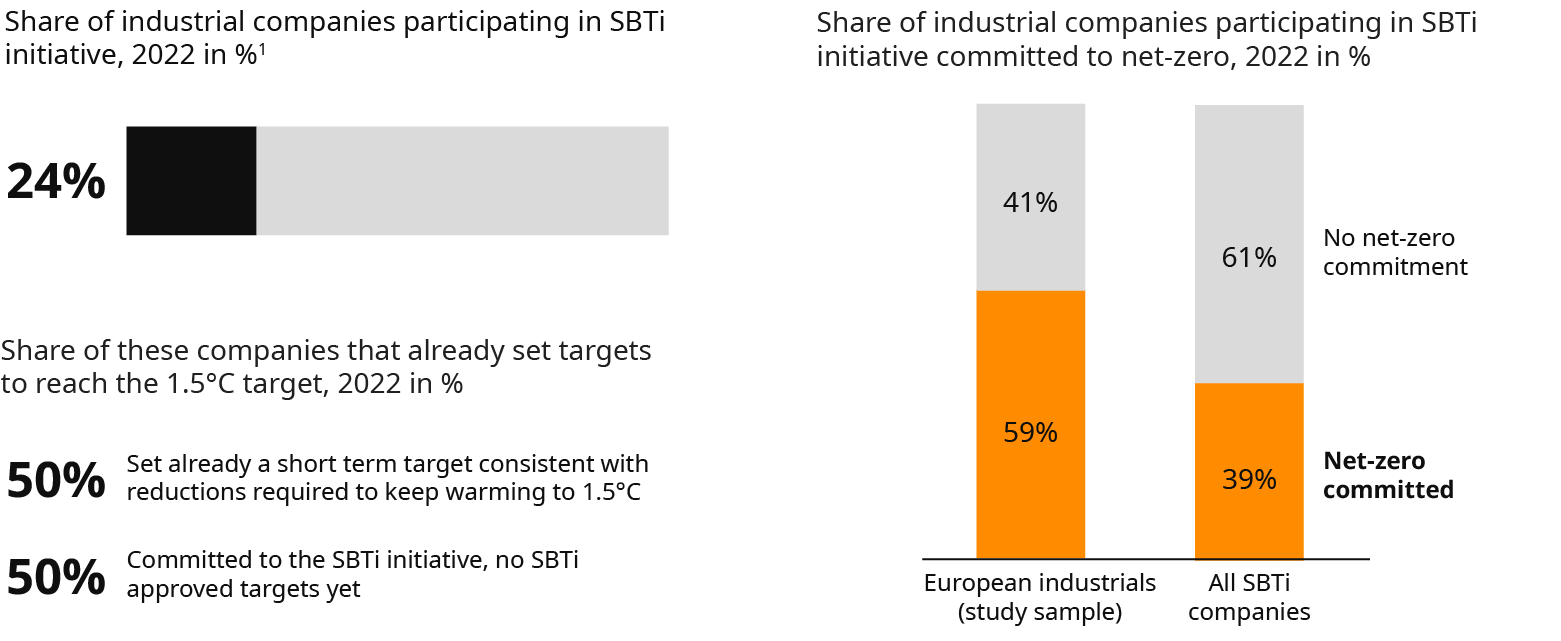
Consider target setting: Around 50% of all industrial firms in our European sample report scope 1 and 2 targets. However, only 24% are participating in the Science-Based Targets initiative (SBTi), which is one of the leading non-governmental institutions approving emission targets. Of those 24%, just 50% have an approved target for 2030 that is aligned with the Paris Agreement goal of limiting the temperature increase to 1.5°C. Only 59% have committed to net-zero — but this is still a relatively high percentage and on average 20% more than other sectors.
Exhibit 13: SBTi participation and net-zero commitment
With regards to scope 3, the number of companies with a disclosed and approved target is even more limited, leaving significant room for improvement.
Sustainability is clearly a value driver recognized by capital markets. Oliver Wyman analyses show that firms with a strong sustainability focus (“A-listed CDP”) outperform laggards by up to 17% in terms of market cap growth. Based on our work for financial institutions, we see more positive financing conditions for firms transforming into a low-carbon business. Firms from the renewable industry, for instance, had a weighted average cost of capital (WACC) that was 37% lower than average over the last years.
A matter of individual excellence
Business model and operational excellence matter — the average profit difference between companies in the highest and lowest performance quartile in each analyzed sub-sector is a full 10 percentage points.
It is crucial to note that a sector’s overall strong performance does not guarantee an individual company’s success. For instance, to be successful, it is not sufficient to simply belong to a strong sector like industrial components. Conversely, even trailing sectors like plant engineering can present opportunities for high double-digit growth and profits. The sector a company operates in structurally drives profit level to some degree, but the specific business model and operational excellence of the individual company is an even stronger driver of profitability. This is also true for capital market valuation, especially in high-growth and disruptive sectors, like software and semiconductor equipment.
Exhibit 14: EBIT margin by sub-sector, 2022
EBIT in %, European company sample
Chapter 2
A Cocktail Of Challenges
As we navigate through 2023, industrial goods executives face many challenges, with inflation and supply risks the most pressing.
The top three concerns still revolve around persistent supply chain disruptions and bottlenecks, the impending risks of inflation affecting the cost base, and the brewing geopolitical tensions manifesting in trade wars and conflicts in regions such as Ukraine and Taiwan.
However, it is crucial to recognize that while these might be the foremost challenges, other significant concerns loom on the horizon. Roughly 48% of survey respondents are concerned about the shortage of labor and the risk of recession.
On the flip side, some challenges seem to be — especially in 2023 — of lower concern, including stringent ESG requirements and the threat of cyber risks.
Exhibit 15: From your perspective, how concerning are the following challenges for your company?
Share of responses in %
Challenge 1: Inflation
The lingering shadow of inflation, which stood at 6.4% EU-wide in June, continues to significantly impact industrial firms. Most companies were able to install proper policies and passed through material cost inflation quite well to their customers, of course heavily depending on market power and competitiveness. However, as supply chain bottlenecks start to ease, this practice is becoming increasingly challenging. Customers are now presented with a broader range of supplier alternatives, and product availability no longer stands as a unique selling proposition.
Adding to these complexities, salary cost inflation has begun to manifest in profit and loss accounts and cannot be passed through as easily. Salaries within the EU industrial sector surged by 5.2% year-on-year in Q1, as per Eurostat data. Furthermore, in the first half of 2023, wage agreements in Scandinavian countries with a strong industrial sector like Sweden and Denmark, for instance, were signed at an increase of more than 4%. As a result, profits come under pressure.
The impact differs by business model. Firms with a short-cycle business, for instance component players, might be able to forward cost to customers but face replacement risks. Long-cycle businesses will see a longer-term margin risk — based on our simulations in the plant engineering sector, for instance, a significant increase of raw material prices without hedging can have an EBIT impact of 7-13 percentage points, depending on exposure and material mix.
The cost of energy provides a telling demonstration of high inflation rates — for instance, the average electricity price for European non-household bulk consumers including taxes and levies has increased by 145% from 2017 to 2022. Inflation, in combination with low energy prices in the US, have led energy-intense European companies to reconsider their strong European footprint. This is further fueled by investment incentives and subsidies, especially in regions like North America. Going forward, increasing (re-)financing costs may also pose a risk, especially to corporates with high debt levels. Consequently, we see European industrials starting to look at performance and cost more intensively.
Challenge 2: Supply risks
With a few exceptions, the classic semiconductor and electronics shortage problems have been resolved. However, new supply chain bottlenecks emerge, particularly when smaller suppliers get into financial turmoil because of inflation impacts, liquidity issues, or staff shortages.
Many companies have built up inventory to ensure availability during the supply chain crises. Raw material inventories in 2022 were more than 30% higher than the historical average and firms now face the challenge of reducing their working capital from overly filled-up stock levels.
Exhibit 16: Raw material inventory development, 2013-2022
In % of revenues, European company sample
Those supply chain challenges have revealed deficits in many companies with regard to structural supply chain resilience in general and cross-functional supply chain steering (sales and operations planning) in particular. We observe a massive need for action in the industrial goods sector.
Challenge 3: The risk of recession
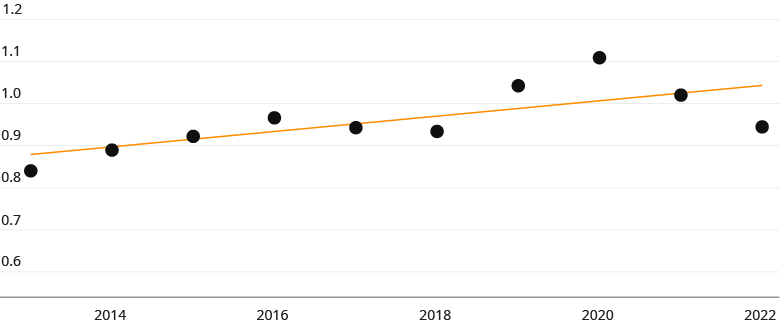
Growth is relatively slow in Europe overall (at 1.1% FC2023 compared to 2022) and recession is a real risk. In fact, core economies like Germany and others are already dipping in and out of recession.
Many firms still sit on high levels of orders at hand. While the order backlog of German mechanical engineering firms in June 2023 is currently declining compared to the end of 2022, it is still almost three months higher than pre-pandemic.
However, since the beginning of Q2 2023, there has been a significant order intake decline, averaging a reduction of 5% per month in a year-over-year comparison from June 2022 to 2023.
These declining orders, when paired with rising costs, create a potentially toxic situation. Companies will inevitably feel the pressure to intensively manage and control costs and the number of restructuring cases will most likely rise. At the same time, there is a heightened risk that strategic transformational efforts (for instance in decarbonization or adjusting business footprints) are put on hold due to other short-term priorities or a tense financial situation. Despite the looming challenges, it is unlikely that we’ll see a broad wave of layoffs, since many companies have learned from previous crises how to sail through, and governments have broadened their support toolkits during critical times. With the current shortage of skilled staff, industrial firms are more inclined to retain their employees, having recognized the pitfalls of hasty, short-sighted layoffs.
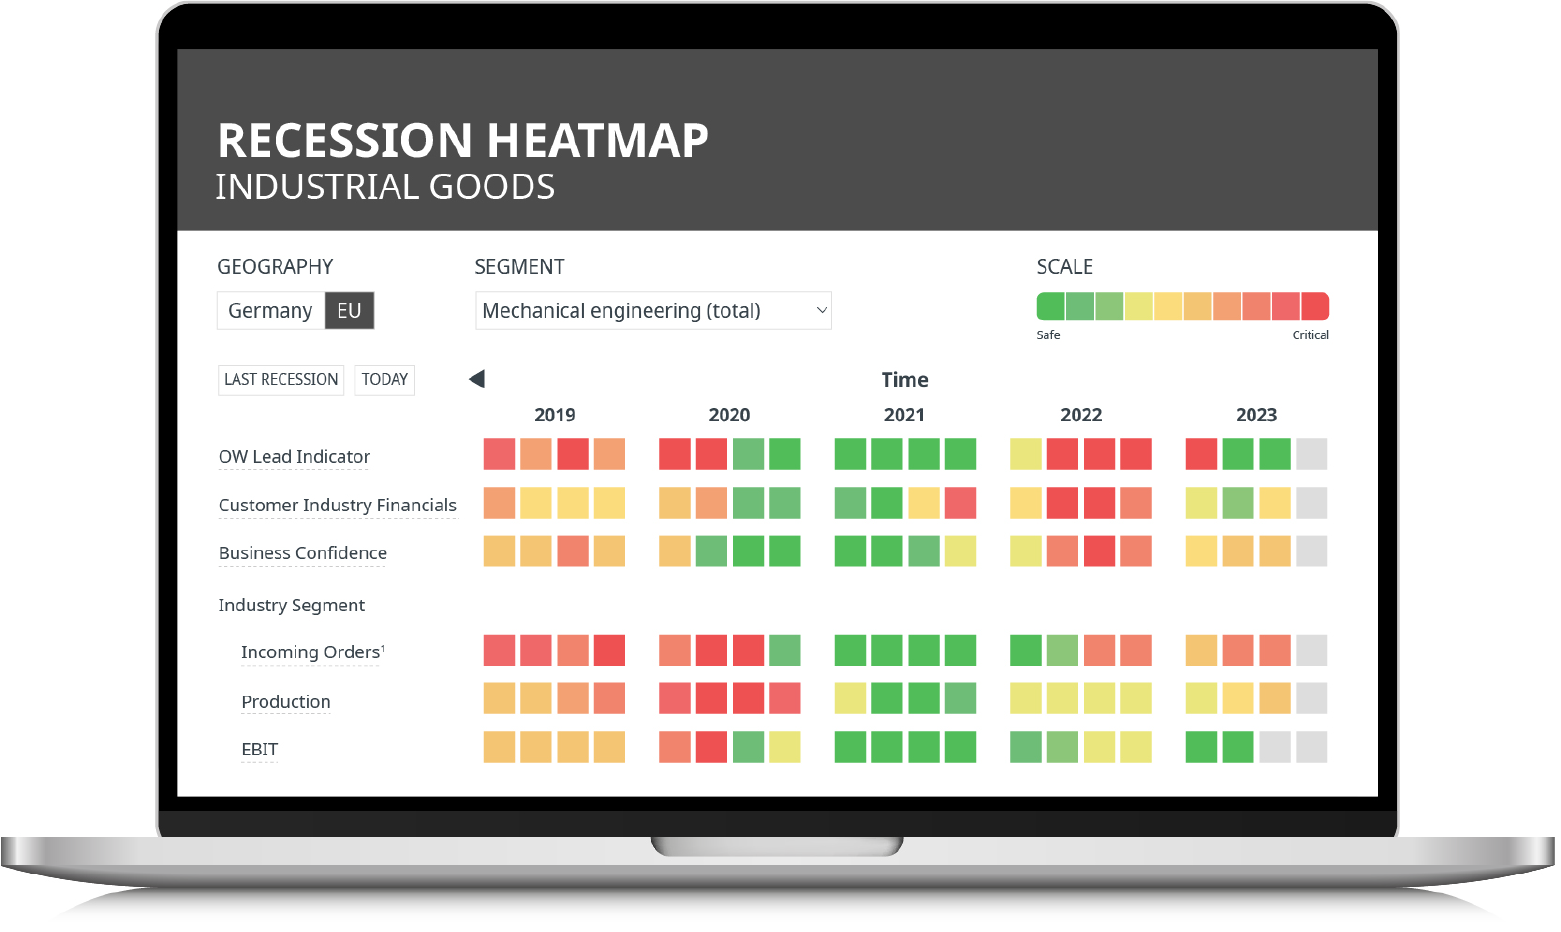
Our recession heatmap summarizes the key indicators. Despite a mixed picture when looking at the classic macro KPIs (yellow), there is some optimism when considering the Oliver Wyman lead indicator (green). The indicator scans press clippings and the popularity of search queries in Google Search (Google Trends — this KPI typically has a time lag of four quarters). When looking at the heatmap, it becomes apparent that there is a difference between sub-sectors (for instance material handling looks brighter than textile machinery).
Exhibit 17: Oliver Wyman recession heatmap
Challenge 4: Labor shortages
The labor shortage is increasing. According to a Eurostat analysis, the job vacancy rate in the EU for the industrial sector stands at around 2% and is thus about 50% above the 10-year average. Before 2017, the rate was typically inverse, with more labor supply than demand.
Demographics drive labor shortage almost automatically. On top, the digital transformation of the industrial sector requires new skills and capabilities, especially in software development, which in most industrial firms are still not sufficiently developed. Competition for these specialized skills is fierce, given their broad applicability in various sectors. For traditional mid-sized businesses, this challenge is even more pronounced since they have limited access and funds to attract talent.
“
Those supply chain challenges have revealed deficits in many companies with regard to structural supply chain resilience in general and cross-functional supply chain steering in particular
The shortage of skilled labor doesn’t just impede growth; it can also have severe financial repercussions. Based on our discussions with insolvency officers, several sectors, including logistics, are witnessing companies slide into insolvency due to labor shortages and an inability to process orders. The industrial goods sector might be shielded a bit more, for instance due to its higher salary level than the aforementioned rather low-wage logistics sector, but the risk remains palpable.
As noted, there is a tendency in some energy-intense sub-sectors to shift value-add to the US, to benefit from incentives and better energy prices. But since the skilled labor shortage is even greater there than in Europe, this could pose a risk to the US growth plans of European companies.
Consequently, the issue of labor shortages has shot up the priority list for many industrial firms. Whether it is developing strategies to attract top talent or heavily investing in automation to reduce their dependence on human labor, the actions companies take now will likely define their success in the coming years.
Exhibit 18: Labor shortage development, 2012-2022
Industry job vacancy rate1 in the EU in %
Chapter 3
New Opportunities
A surprising result of the executive survey in 2023 is the overwhelming enthusiasm towards digital solutions, with more than 75% of respondents identifying a high to very high potential in enhancing their portfolio with digital offerings. Another large group of executives considers traditional strategies around exploring new markets and new regions as most promising (with 70% saying it has high potential/very high potential). While this may not be a disruptive opportunity, it’s a proven way to grow business and is potentially influenced by many European firms looking for alternatives to the classic growth market: China.
Interestingly, all new business models and M&A-related opportunities are ranked lower (both with less than 50% limited potential). This likely stems from the prevailing unpredictability in global markets, making executives wary of adopting strategies that come with substantial risk. Nonetheless, we expect M&A activity to go up due to lower valuations and increased consolidation pressure.
Exhibit 19: How do you assess the potential of the following opportunities for
your company?
Share of responses in %
Opportunity 1: Digital and artificial intelligence
We perceive a new wave of optimism around digital opportunities, driven by the buzz surrounding artificial intelligence (AI) and massive promotion campaigns of tech giants. Digital opportunities can be thought of in two categories: internal enhancements from process digitalization, and digital products or business models.
As it stands, digital products have yet to become a major revenue and profit stream for the industrial sector. A limited number of success stories for digital business models can be observed. On the internal improvement side, sizeable value is waiting to be unlocked. However, industrial firms are still only scratching the surface of digitalization in general, and in particular with regards to building customer-oriented use cases that tap into the full potential of AI.
Let’s delve a bit deeper and differentiate classic AI and generative AI. The former makes decisions based on rules learned from large sets of static training data. The latter, generative AI, responds to dynamic inputs to create new data — be it images, text, or audio — that mimic real-world or human-generated content. For the industrial sector, classic AI will likely provide significantly higher value than generative AI — especially when considering the cost and balance sheet structures of industrial manufacturers. Think of use cases such as demand forecasting or in-line quality controls in production.
While generative AI is hailed as a potential game-changer in sectors like the media, its impact on the industrial goods industry will be less transformative. Industrial products are tangible in nature and cannot be conjured solely from data or in a virtual world. With much of the physical value creation already automated, the scope for generative AI’s disruptive influence is limited.
Nevertheless, the remaining, largely human-driven processes stand to benefit from generative AI’s capabilities. It holds promise for innovation in areas like product design, software programming, and customer support that could turn out to be readily attainable. However, its impact on a firm’s overall cost position is likely to be limited and the creation of a significant competitive edge doubtful. Interestingly, the adoption curve for generative AI may outpace that of its classic counterpart, largely because it is becoming a staple in modern software suites used by industrial goods companies.
Opportunity 2: Exploring new markets
We see strong momentum among firms to explore new markets. One vector of new market exploration is related to aligning product and service portfolios with global megatrends, for instance around the shift away from combustion engines or towards more software and automation offerings.
Another vector is expanding regionally. Expanding into new regions usually make sense — especially considering the current growth weakness and demographics in Europe. However, growth opportunities in Europe should not be neglected. Various regulations and incentives, in particular related to the energy transition, create the ground for new equipment markets (for instance hydrogen infrastructure and production). In addition, geopolitical challenges pressure governments to subsidize local backshoring and regionalize value chains (for instance new semiconductor production in Europe). Of course, depending on the sub-sector, firms need to be active in those areas to leverage the benefits.
In the event of increasing trade conflicts, industrial firms should consider harnessing the market opportunities that emerge from a weakness of Chinese competitors in the western sphere — especially in areas where Chinese firms already have a significant share. A new economic battleground will particularly arise in neutral markets outside of the core alliances, especially ASEAN and India. Both are attractive regions, driven by advantageous demographics and inherent growth. At the same time, competition with Chinese players will be tough, which requires particularly effective strategies from western industrial firms.
For most sub-sectors, the US is currently generally quite attractive for European firms. Localization can become an opportunity to gain market share in the North American region — on top of underlying market growth.
Opportunity 3: Sustainability
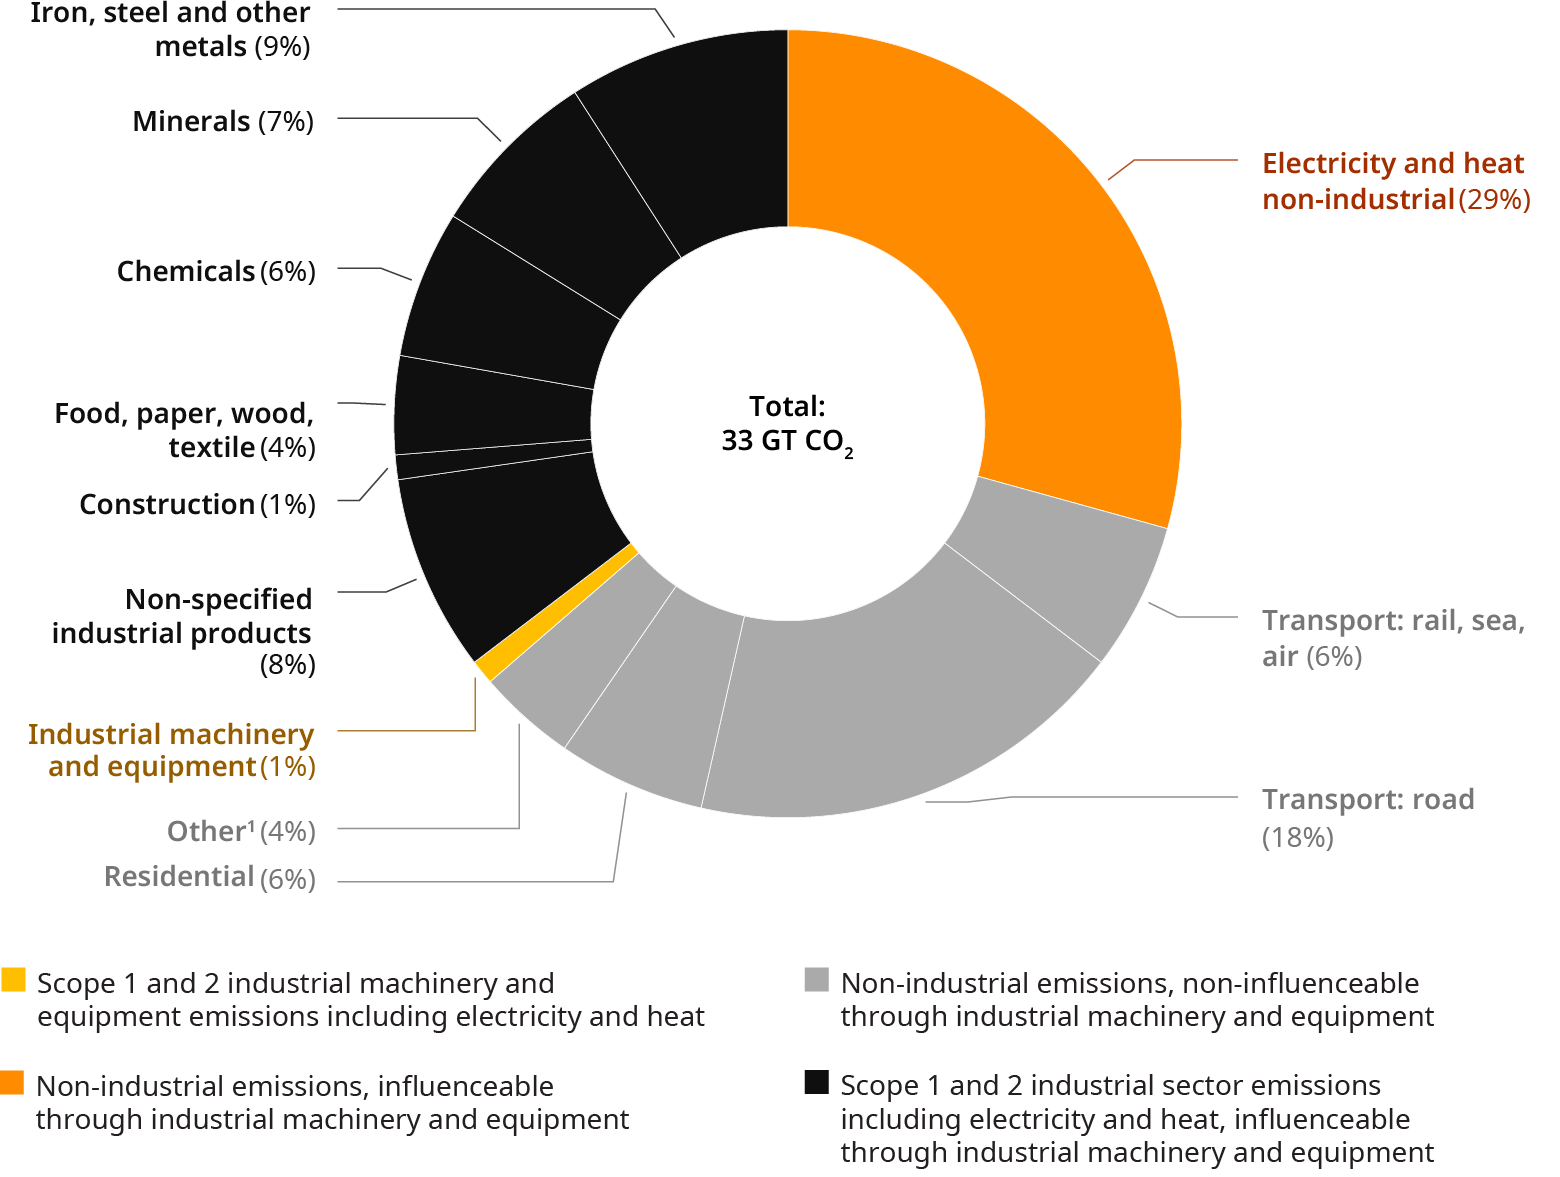
Sustainability is one of the key underlying growth themes for the industrial goods sector. When looking at the full spectrum of emissions, the industrial goods sector itself is responsible for only a relatively small share of total emissions (around 1%). However, numerous sub-sectors within industrial goods will play a pivotal role in providing the technology to substantially reduce emissions at their customers’ sites.
Our estimate shows that the industrial machinery and equipment sector, with its cutting-edge technologies, can tackle sectors that are responsible for more than than 70% of the total emissions. Those sectors include energy, steel production, chemical production, paper production, construction, and off-highway equipment.
Exhibit 20: Worldwide CO2-emissions by sector, 2017
In % of shares
Industrial equipment players will find growth opportunities in areas like battery manufacturing, recycling technologies, carbon capture technology, equipment for hydrogen production and infrastructure, electric drive products, infrastructure equipment as backbone for electrification transmission technology, and many other topics.
Clearly, these growth opportunities will not always come on top of the current revenue baseline. In many cases, they even replace so-called dirty technologies. Still, sustainability reflects a major opportunity for many industrial firms to reinvent themselves, their product portfolio, and their business models to gain a competitive edge.
“
Sustainability is quickly becoming a determining factor due to the heightened attention it receives from investors, banks, regulators, and sector end markets
Chapter 4
Excursus: Geopolitics
The current geopolitical situation — and its impact on industrial goods firms
There are various geopolitical hotspots around the world, but while some of them have been simmering for decades, others have increased in recent years. Most notably, the relationship between China and the United States has soured. Moved into the spotlight by former President Trump, the fundamental conflict between an America striving to maintain the existing global order and keep China in check and a rising China has become more evident. Policies have become even more clearly articulated under the Biden administration. Adding to the complexity is the expressed Chinese ambition of reunification with Taiwan — peacefully, if possible, but explicitly not renouncing the use of force. President Biden, while committed to the “One China” policy status quo, has made clearer than any administration before that US forces would intervene on behalf of Taiwan.
The European Union, having much closer economic ties with China, has come out in favor of “de-risking” its relationship with the country, rather than “decoupling” from it. And while the language has since been taken over by American officials, the fundamental divergence of western and Chinese views and political objectives remains. A resolution of the conflict appears further out of reach than only a few years ago.
Russian President Putin’s invasion of Ukraine has proven to be an escalation of another geopolitical conflict. Ending an era of peace in Europe and sending energy prices surging in its wake, it threatens the competitiveness of European industrial companies. Further geopolitical conflicts continue to linger around the world, from the division of the Korean peninsula to the Middle East. And with the next US election approaching in 2024, even a revival of US trade war rhetoric towards Europe cannot be dismissed.
European manufacturers are particularly exposed
For European manufacturers, globalization has been a guarantor of success. The share of revenue generated in foreign continents further increased over the last five years. Today, with almost two-thirds of revenue generated beyond Europe, manufacturers are particularly exposed to geopolitical events. Peers in North America have traditionally benefitted from strong demand in their home market. Similarly, Chinese manufacturers rely on the Asian-Pacific (APAC) (including China) region, which contributes 80% of revenue. While Chinese companies have made leaps in product quality, they tend to face concerns among western B2B customers in availability of long-term support and service, among other things.
Exhibit 21: Sales by region, 2017-2022
Revenue in % of total
European manufacturers also have a more diversified asset base. Only about half of assets remain in Europe. In seeking to grow their market share, European companies made significant investments abroad, especially in the Americas. Besides lower costs for energy, this momentum has been reinforced by US incentives to produce locally; initiated by the Trump administration’s “Buy American” initiative and propelled more recently, for example, by the Inflation Reduction Act. The asset share in APAC is 11%, which is disproportionately small when compared to revenue (22%). Concerns around intellectual property leakage have traditionally slowed the localization of production in China. Conversely, both North American and Chinese industrial goods companies show a significantly higher concentration of assets in their home region.
Exhibit 22: Assets by region, 2017-2022
In % of total
Executives must consider China contingencies
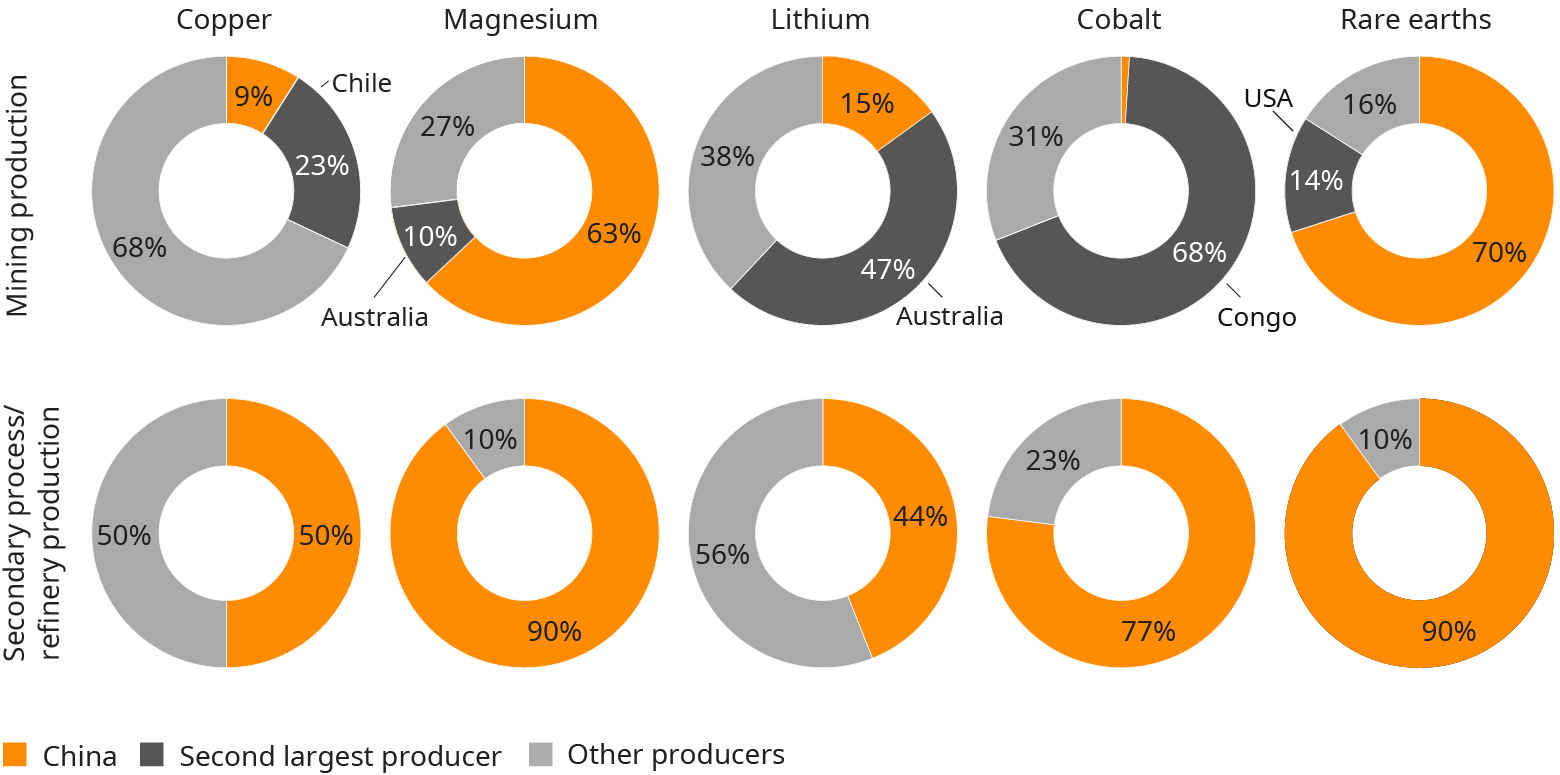
Relations with China are especially critical for European manufactures. China is not only a key sales geography and frequently serves as a manufacturing hub for Asia but is also a vital procurement market. The dependence on Chinese materials and components became evident during the COVID pandemic, when supplies from China abruptly dried up. Many companies started to investigate their supplier networks in earnest for the first time, identifying bottlenecks and developing mitigating strategies. Dual sourcing is part of the portfolio of measures that purchasing departments are turning to. While this can significantly contribute to mitigating risk — albeit in most cases at higher costs — it is only applicable when sourcing alternatives are available. In the case of some raw materials or its processed forms, it is hardly possible.
Exhibit 23: Market shares of raw materials, 2022
In % of total
With the strong exposure of their companies to China, European industrial executives must think ahead. The following scenarios illustrate developments that could drastically affect business and competitive conditions between the west and China.
Scenario 1: The normalization of the relationship
While there are currently few signs pointing in this direction, a shift in geopolitical dynamics and a reversal in the protective stances of the US and China could restore the geo-economic normality of the pre-trade war era. A return to economic cooperation would boost trade, lower production costs, and reintroduce a sense of stability, supporting investment. With a more level playing field, competitive pressure would increase, especially from Chinese competitors in western markets.
Scenario 2: Partial decoupling
An extrapolation of the status quo could be considered a baseline scenario. The US and China continue their policies of shoring up domestic industrial supply chains while restricting exports and investments in critical sectors. Already, the world has seen the launch of powerful instruments across the US, Europe, and China.
The first category of instruments provides incentives to strengthen domestic economies, localize strategic industries, and re-shore manufacturing jobs. These instruments provide a massive opportunity to industrial goods companies. The estimated volume of the American CHIPS and Science Act is around US $280 billion, the Inflation Reduction Act includes $369 billion for energy security and climate change, and the Infrastructure Investment and Jobs Act contains new infrastructure investments of around $550 billion. The EU, through its own CHIPS Act, aims to double its share in global semiconductor production from 10% today to 20% in 2030. The Next Generation EU program facilitates especially the green transition and digital transformation of member states, deploying grants and loans worth around €700 billion. Recognizing Europe’s dependence on imports from quasi-monopolistic suppliers such as China, the EU has triggered measures that mitigate supply chain risks through the Critical Raw Materials Act. China’s industrial policy has long involved extensive state support and intervention in industrial sectors. Introduced in 2015, the Made in China 2025 initiative strives to shift China from basic manufacturing to advanced production, fostering global tech champions. The China Standards 2035 Plan, unveiled in 2020, claims a leading role for China in writing global standards for emerging technologies like AI and the Internet of Things (IoT). Collectively, these strategies underscore China’s aspiration for global high-tech dominance. In response to COVID, China reinforced its commitment to these initiatives and earmarked around $1.4 trillion for a next-generation infrastructure program.
A second category of instruments enforces desired behavior through restrictions and penalties. The US has laid out a policy of a “small yard, high fence,” excluding certain high-tech sectors from free trade with China. For this patch of industry, spanning, for example, artificial intelligence, quantum computing, and semiconductors, the US restricts exports to China. President Biden further tightened the screws by signing an executive order introducing a screening of investments by US companies in China. In this scenario, progress toward lowering trade tariffs from Trump administration levels remains unlikely. The EU follows in the footsteps of the US — also due to the US’s expectation to follow its policies — although with greater focus on supply chain resilience and characterized by higher economic dependence on China. These restrictions require companies to screen entity lists and have deep transparency into their supply chains.
EU politicians are looking at reducing export guarantees to China and express sympathies for the US approach on outbound investment screening. China, seeing itself as responding to US actions, created its own legal framework. The Anti Foreign Sanctions Law, for example, provides a legal basis for potentially far reaching action, from denying entry to the territory of China and asset freezes to restrictions on doing business with PRC individuals and organizations. An understanding of Chinese expectations is required by western companies to fly under the radar and assess repercussions of actions on their China business.
Scenario 3: Complete decoupling
A complete decoupling between the US-led west and China could be triggered by various events — most prominently a military escalation of the Taiwan question. In an extreme scenario, the US and Europe would sever economic and financial ties with China, causing a chain reaction up industrial supply chains and a collapse in demand. Western companies are exposed on two fronts. The first order effect is the direct loss of business and potentially assets in China. The more severe effect, however, will in most cases result from the loss of business with western customers ramping down production due to being cut off from vital supplies and market access in China, and the resulting world economic crisis. While the direct effect can usually be quantified based on a company’s revenue mix, the second (and third) order effect is more difficult to grasp. This scenario would have a tremendous effect on the global economy, so the question is whether a complete decoupling would be a new world order or just a temporary state. In any case: be prepared.
For some companies, there might be a silver lining. In a complete decoupling scenario, Chinese companies could lose access to markets aligning with a US-led western sphere, making it possible for western competitors to gain market share. The extent of this effect is specific to the respective market and the Chinese market share. An analysis of the revenue generated by Chinese companies outside China indicates a potentially material effect especially in the material handling, power systems, and off-highway markets.
Exhibit 24: Foreign revenue share of Chinese companies by sub-sector, 2022
In % of shares
While a full decoupling remains a low probability scenario based on the current trajectory, the geopolitical environment remains highly fluid. The military build-up in the Asia Pacific region is proceeding at a rapid pace and the potential for miscalculation by the major powers is high. The Chinese government remains committed to its "historical task" and seeks a peaceful reunification with Taiwan in the long-term, while US presidential elections might add to the volatility in the short-term. In short, companies cannot discount the risk of a rapid escalation and full decoupling over the coming decade, and must plan appropriately.
The need for change is clear, but companies are not prepared
The above three scenarios reveal a change of boundary conditions that is already in full swing, distorting the economic playing field. Facing the risk of further deterioration of western-China relations, executives must respond, and priorities appear clear, as illustrated in the following exhibit:
Exhibit 25: Which potential fields of action do you prioritize in relation to a potential decoupling scenario (separation of the economies of the “China-led sphere” from the “US-led sphere”)?
Share of responses per category in %
The top three fields of action include a redesign of supply chains, which has been top of mind for many since recent supply disruptions exposed vulnerabilities. Executives are also eyeing potentially neutral countries as future pockets of growth. Markets such as India and Brazil avoid being pulled too far into one of the competing spheres. Finally, risk management requires an upgrade to account for the geopolitical dimension, in the eyes of the surveyed executives.
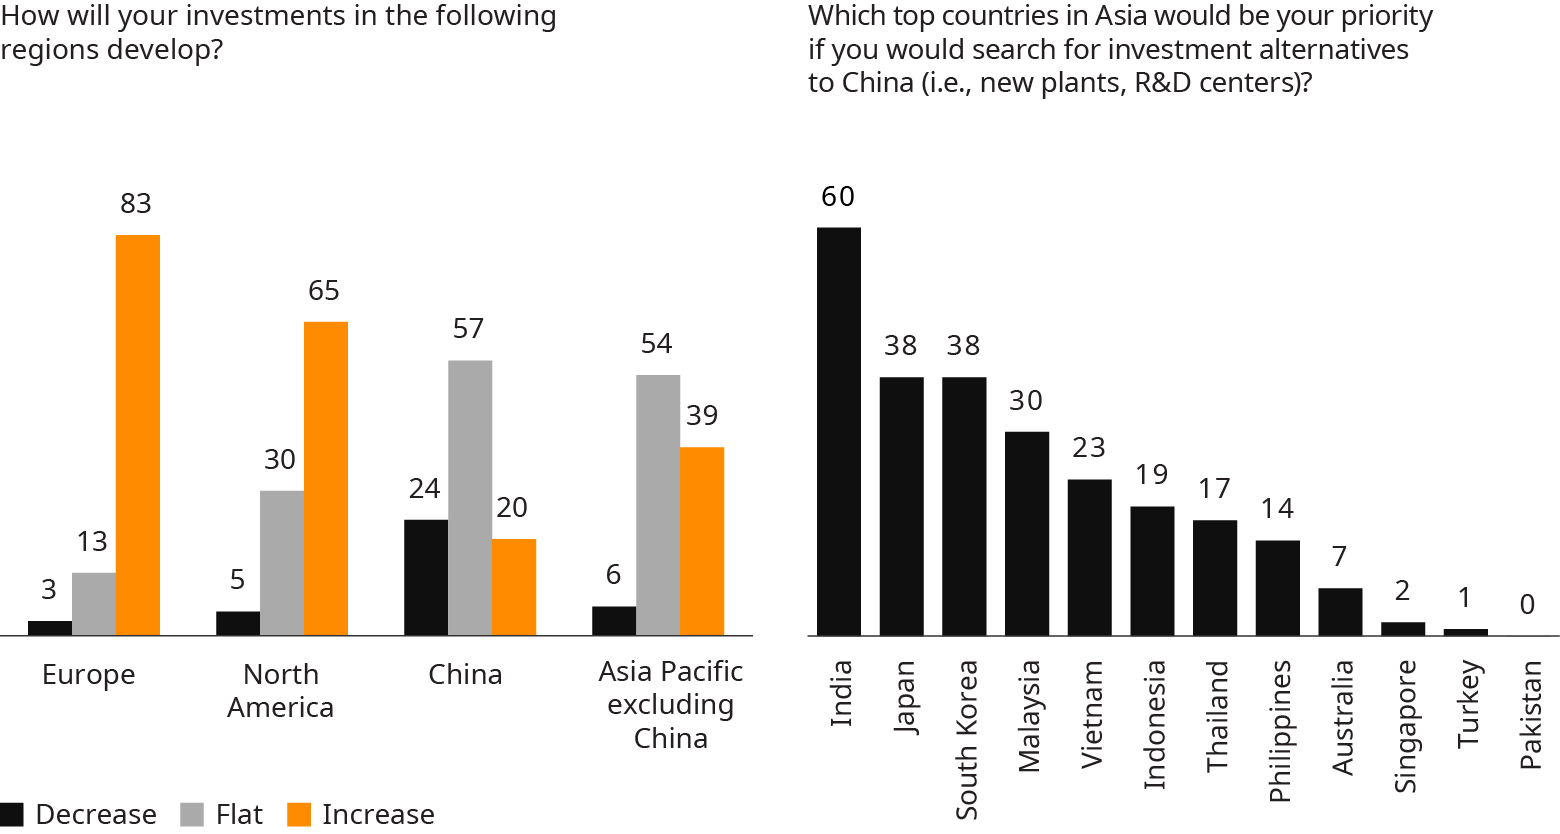
Interestingly, views are more split on the need to adjust the manufacturing footprint. Here, an investigation of future investment plans provides more clarity, revealing a stark difference between the two spheres: 83% plan on increasing investment in Europe, and 65% in North America. Answering to subsidies and the gap in energy prices, some European companies are moving new production facilities to the US. Caution prevails with China, but the majority are still planning on keeping investments constant. Localization of industrial production is frequently a complex and capital-intensive undertaking. And even if the business case is clear, sophisticated machinery and complex processes require highly specific skill sets that may be unavailable in the target labor market. With regards to China, executives are also hesitant to further localize production, fearing not only leakage of intellectual property, but also uncertainty around future developments.
Exhibit 26: Most of the participants’ companies plan to increase their investments in Europe; India is the most popular investment alternative to China
Share of responses in %
From China, investment attention is rather pivoting to non-China APAC, where 39% of European executives plan on increasing investments, and only 6% plan to decrease. The APAC region is the beneficiary of increasing China-hesitation, offering a combination of cheap labor, a growing pool of skilled workers, and better perceived protection against geopolitical upheavals, among other factors. In their quest to find alternatives to China, executives are overwhelmingly turning to India.
While the fields for action appear clear, only 48% of surveyed executives feel confident in their company’s readiness to navigate this dynamic geopolitical landscape.
Exhibit 27: How well is your company prepared to deal with the new dynamic geopolitical situation?
Geopolitical risks are here to stay — and must be managed
For industrial goods companies, geopolitics has emerged as a force to be reckoned with. The individual risk profile of a company is highly specific to its circumstances — its supplier base, footprint, markets served, and competitive environment. However, focusing solely on the sourcing or footprint perspective risks missing the full magnitude of the implications. If anything, the industrial sector is confronted with the challenge to build out a robust risk management system that adequately integrates the geopolitical dimension.
Executives must ensure that geopolitical exposure is systematically monitored and reviewed. A clearly defined geopolitical risk appetite should guide decision making. Geopolitical risk considerations need to be interwoven with the strategic and day-to-day processes of the company. Decisions on operating model, footprint, supply chain, and M&A, for example, must consider consequences for the geopolitical exposure: To what extent should redundancy be built into the manufacturing footprint? Should the hub for Asia remain in China? Can new partnerships or joint ventures secure strategic access to critical raw materials? Are existing cross-geo intercompany supplies at risk? What is the correct setup for China? Should the company exit Chinese joint ventures or could new ones, in fact, minimize risk? What would happen to company IT systems if the connection to China was disrupted? While executives ponder questions revolving around mitigating risk, they should not lose sight of opportunities. Growth strategies should account for a decoupling dynamic and explore opportunities in the western, neutral, and Chinese hemisphere.
The geopolitical state of the European industrial goods sector is highly exposed, and executives have realized the magnitude of the challenge. It is now up to them to act.
“
Executives must ensure that geopolitical exposure is systematically monitored and reviewed
Chapter 5
Sector Outlook
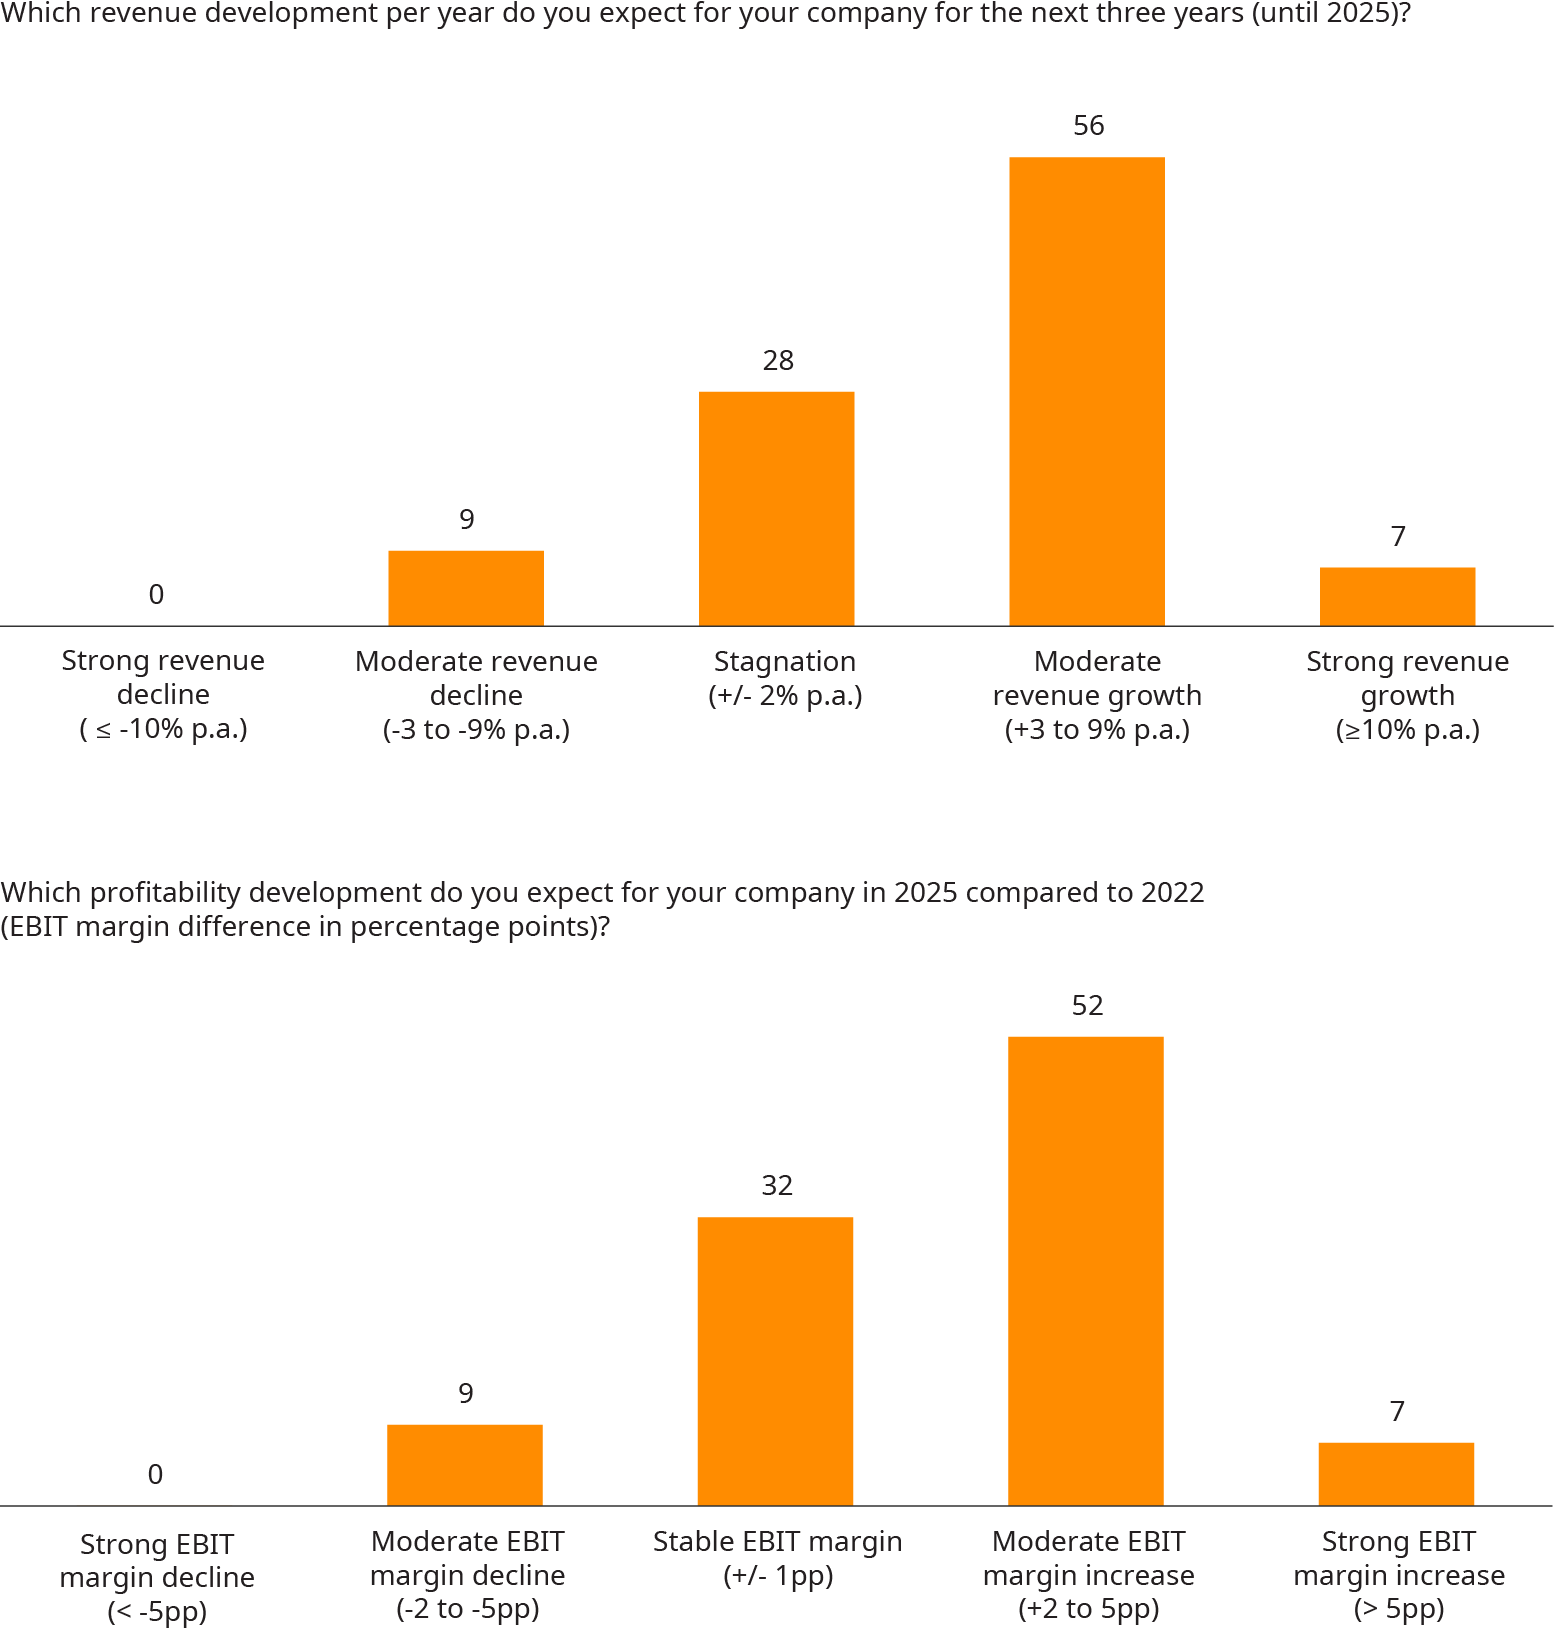
Overall, despite current headwinds, European executives in the industrial goods sector are confident of the future of the sector and the mid-term economic outlook up to 2025. Around two-thirds of respondents expect revenue growth for their companies, most of them moderately, defined as 3-9% per year (see graph below). Only around every tenth respondent expects a decline in revenue. Larger businesses seem to be more bullish than smaller firms, with 67% indicating moderate or strong growth expectations compared to 57% of smaller firms.
These positive forecasts from executives presumably factor in anticipated inflation, so the figures are not reflecting pure volume growth. Similarly, when considering profitability, a significant portion of executives foresees higher profit margins, with many predicting an EBIT margin improvement ranging between 2-5%, implying — somewhat surprisingly — that the current inflationary pressures can be overcome relatively quickly. It is also worth noting that, with regard to profits, respondents from larger firms tend to be more optimistic about their profit trajectories compared to their smaller counterparts, with 71% of larger firms anticipating moderate to significant EBIT improvement, as opposed to only 52% of smaller firms.
This overall positive expectation may be driven by a desire to rebound after the recent inflationary pressures. In essence, many respondents seem to anticipate a return to a more stable — or “normal” — business environment. Combined, a majority expects continued profitable growth — which is comparable to the average development over the past 5 to 10 years.
Exhibit 28: Mid-term expectations
Share of responses in %
A confident view of the sector’s future is also supported by equity analysts: Most industrial stocks (about 70%) receive an “outperform” or “buy” recommendation (compared to “hold/no opinion/sell” at about 30%) — an all-time high. Interestingly, the aggregated consensus guidance based on broker reports and analyses for the companies included in our sample is slightly lower. Capital markets are more skeptical than the sector representatives in our survey. However, that is only the average view. When looking at the guidance analysis by sub-sector, brokers are much more optimistic on 2024 revenue outlooks for firms in the semiconductor, industrial software, and power systems sub-sectors, than for the material handling and off-highway equipment sectors. Most of the optimistic guidance refers to sub-sectors that are exposed to the major megatrends and are expected to benefit disproportionally from ultra-hot topics like digital/AI and decarbonization.
Exhibit 29: Average analyst recommendations, August 2023
In % of companies, European company sample
In conclusion, the industrial goods sector overall is in good shape and remarkably holding up in resilience, despite fundamental shocks. Value keeps on growing, but is shifting significantly — between subsectors, regional archetypes, and individual companies.
The sector shows a good portion of confidence in the mid-term future with numerous opportunities in the pipeline, including AI, low-carbon technologies, and new markets. However, major risks and challenges are either looming or already here, such as inflation, geopolitical turmoil, and recession.
The industrial goods sector has many dynamics that need to be navigated skillfully by industrial firms. Successful companies must find the right balance between bold transformational moves to reflect longer term structural trends on the one hand, and keeping strategic optionality while remaining flexible in light of potential further disruptions on the other.
It will be exciting to follow and observe the sector in the future. The coming years will be critical and — like the previous ones — most likely full of surprises.


